The 100-Lead Experiment To Stop Wasting Inbound Leads: Final Update


Jump to the weekly results:
Experiment Introduction
What We’re Trying To Fix With Nectafy's Inbound Leads
We’re on a mission to stop wasting our own inbound leads. And the way we’re going to do it is by experimenting with a simple new sales process, and then publicly sharing all our sales data. Follow along while we work on the next 100 leads, then share the results with you each week.
Good inbound leads can be missed—or left to languish—for a number of reasons. Here’s some insight from Lance (our founder, and our one salesperson):
“I'm the sales guy for Nectafy. I'm the guy that's supposed to be not wasting high-value inbound leads. However, I know I've been wasting inbound leads. I have lots of thinly veiled excuses:
- They’re not great leads.
- It's working well enough.
- Marketing just sends us junk leads.
- I don't have the time.
- If those are good leads, they'll contact us.
- We don't have a simple, clear, repeatable process.
- We only want to work with people who really want to work with us.”
We need to fix the issue.
To make it fun, we’ll be sharing weekly updates on our progress for the next 100 leads that come through Nectafy.com (through our HubSpot portal). We’ll track and share our results from form submission (contact) to customer and revenue. Here are the sales activities we’ll track:
- Contacts: A form submission on Nectafy.com (not just a subscriber to our blog or a previous contact who is filling out another form)
- Qualified: Contacts who work at a B2B company (not marketing agencies), have a website, and communicate in English
- Contacted: Contacts who we have gotten in touch with
- Meetings: Contacts who we’ve had a sales meeting with
- Proposal: Contacts who have received a proposal from us
- Customer: Contacts who have signed the proposal and become a Nectafy client
- Monthly recurring revenue (MRR): Monthly revenue for new customers
Benchmark Data
Here’s what happened with the 100 leads that came in before our experiment started. These are the numbers we need to beat over the next 100 leads that come in.
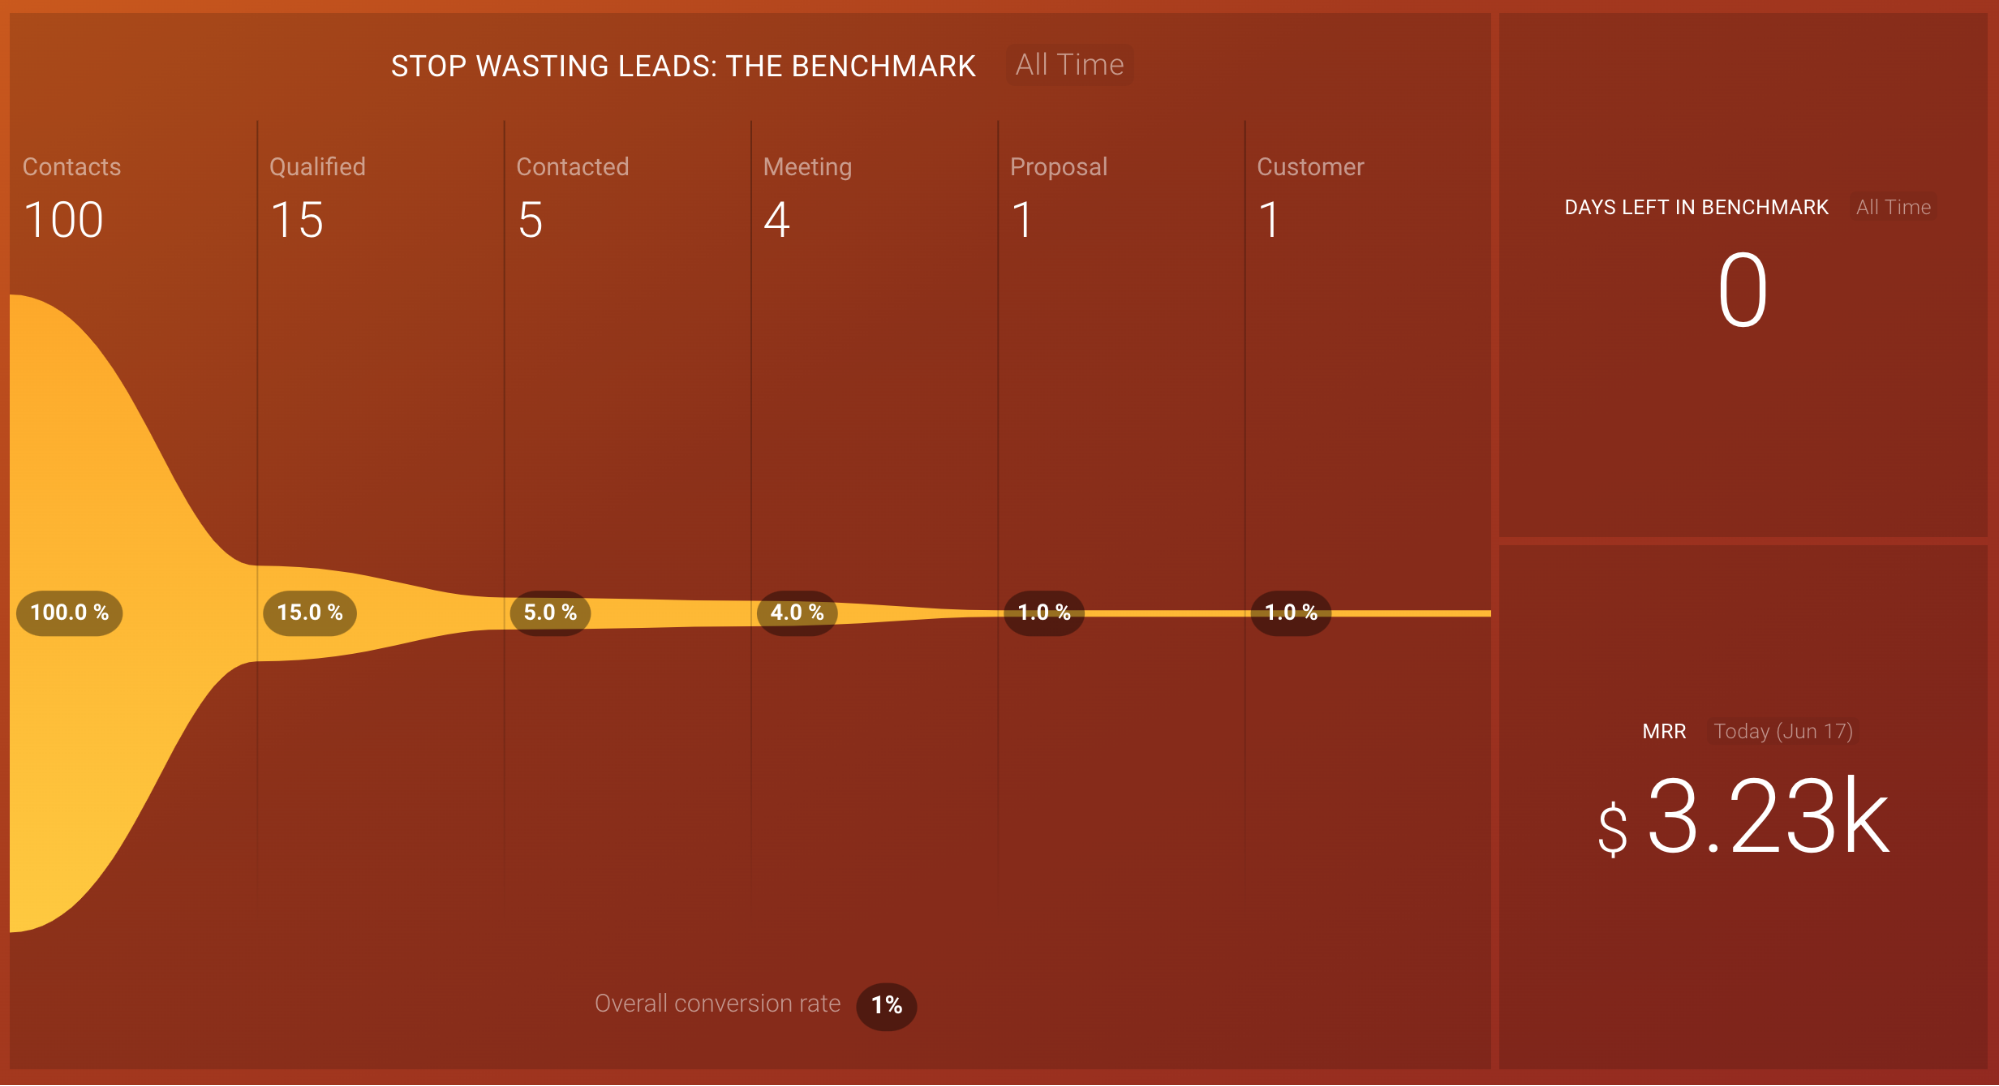
Click here to view the live databoard online.
The Simple Sales Process We’ll Use
To avoid wasting good inbound leads, we need a simple, consistent sales process. Here are the steps we’ll take with each lead:
- Qualify each lead using this criteria: The contact works at a B2B company but not a marketing agency, the company has a website, and they operate in English.
- Send a personal email to each qualified contact that includes a personalized video of under one minute.
- Send a follow-up email and LinkedIn message three days after the video.
The goal is to set up a meeting. When a meeting takes place, the next goal is a proposal, and then a client.
Week 1 Results: Through 18 Leads
The Data
Week 1 Takeaways
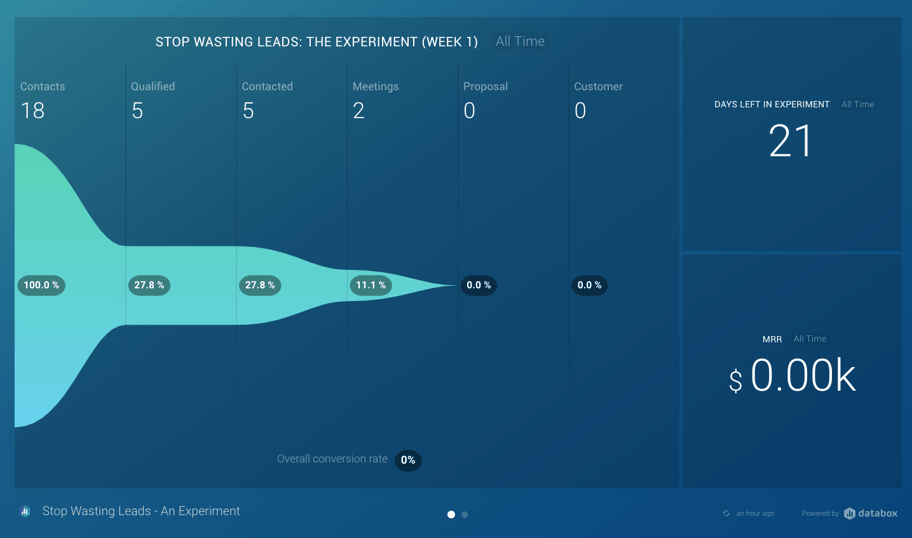
All of the important numbers at the top of the sales cycle have increased dramatically in the small sample size of week one. However, that has yet to turn into growth in the bottom of the funnel (new customers and revenue). Here are the details.
- Qualified: The percentage of qualified contacts as a percentage of total contacts has gone up (28% through week one vs. 15% in the benchmark), but that's randomness. We're not doing anything in this experiment to impact that number.
- Contacted: In the benchmark, we contacted just five out of 15 qualified contacts (33%). Through week one, we contacted 5 out of just 18 leads (28%). The experiment has forced us to absolutely get in touch with every qualified lead, and the improvement shows.
- Meetings: In the benchmark, we had meetings with just four out of 100 total contacts. Through week one, we had two meetings out of just 18 total contacts. The meeting rate has more than doubled (albeit on a small sample size).
- Proposal, Customer, Monthly recurring revenue (MRR): Through week one, these have all come in at zero. So far, the improvements higher up in the funnel due to the experiment haven't kicked off new customers for Nectafy. But with a sales cycle always longer than one week, we hope to see these results come in later in the experiment.
Challenges We Faced
The experiment has forced us to look at every single lead that comes through and take an action on it. That's great. In doing this, however, we discovered a few issues in managing these leads.
- We want only true Nectafy leads. Sometimes, a friend, job applicant, or an existing customer will fill out a form on the site. Those get counted toward the number of contacts. We don't want to include those, so we delete them out of HubSpot altogether. But that takes manual work.
- HubSpot's sales integration with Gmail creates contacts. Whenever Lance emails with someone he hasn't before, that person gets created as a contact in HubSpot. We don't want those people counted because they aren't true inbound leads for Nectafy.
I mention those two challenges because it has felt like in the past that the total number of contacts generated through HubSpot doesn't feel too useful. Issues like this may be why, so keep an eye out for challenges like these.
Week 2 Results: Through 37 Leads
The Data
Week 2 Takeaways
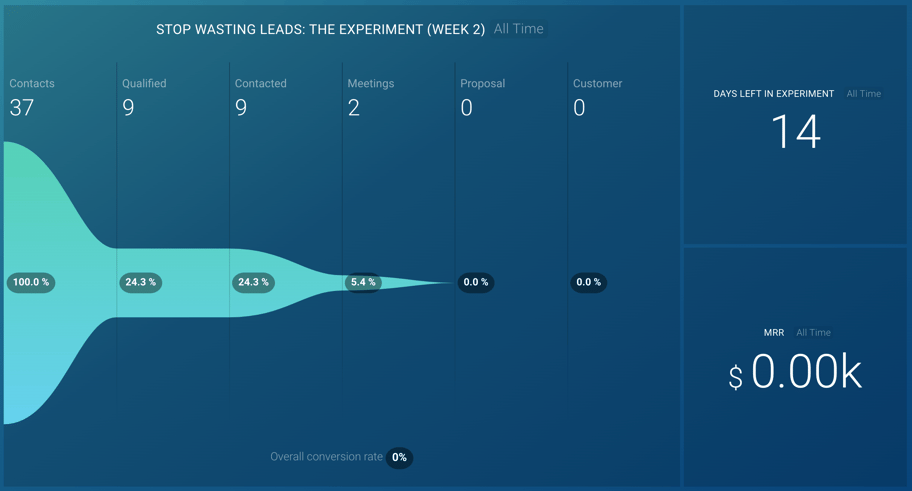
Much like after week one, all of the important numbers at the top of the sales cycle have improved but that has yet to turn into proposals, customers, and revenue. Here are the details.
- Qualified: The percentage of qualified contacts as a percentage of total contacts has gone up (24% through week two vs. 15% in the benchmark), but that's randomness. We're not doing anything in this experiment to impact that number.
- Contacted: In the benchmark, we contacted just five out of 100 total contacts (5%). Through week two, we contacted 9 out of just 37 leads (24%). We've forced ourselves to get in touch with every qualified lead and we're sticking with it.
- Meetings: In the benchmark, we had meetings with just four out of 100 total contacts (4%). Through week two, we had two meetings out of 37 total contacts (5%). That's a slight increase, but with such a small sample, not significant.
- Proposal, Customer, Monthly recurring revenue (MRR): Through week two, these have all come in at zero. So far, the improvements higher up in the funnel due to the experiment haven't kicked off new customers for Nectafy. But with a sales cycle always longer than one week, we hope to see these results come in later in the experiment.
As we get closer to 100 leads in the experiment (we're just 37% of the way there now), we hope to see some of the top-of-funnel improvements kick down to the bottom. There is hope since our sales cycle is usually longer than 30 days.
Week 3 Results: Through 51 Leads
The Data
Week 3 Takeaways
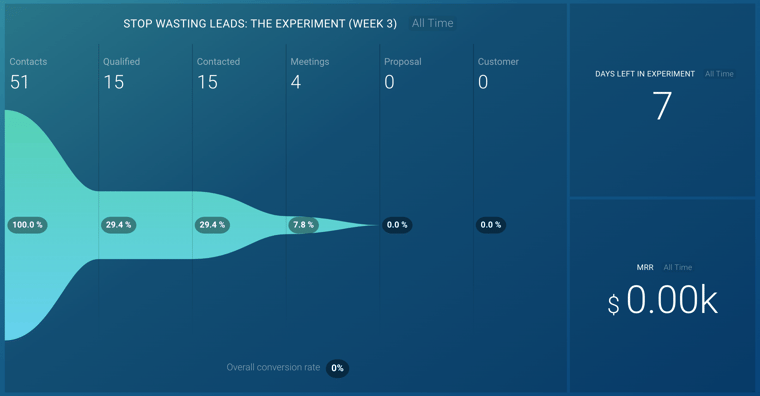
The meeting rate (sales meetings divided by the total number of contacts) is double that of the benchmark. It's still a small sample size, but it's becoming more clear that reaching out to each qualified lead with a personalized video is helping. More people are willing to meet. Now, we still need to see if that turns into more proposals and customers.
- Qualified: The percentage of qualified contacts as a percentage of total contacts has gone up (29% through week one vs. 15% in the benchmark), but that's randomness (or our marketing has improved). We're not doing anything in this experiment specifically to impact that number.
- Contacted: In the benchmark, we contacted just five out of 100 total contacts (5%). Through week three, we contacted 15 out of 51 leads (29%). We've benefited from more qualified leads, but the experiment has made sure we get in touch with each. That simple process has cut out a lot of wasted opportunity.
- Meetings: In the benchmark, we had meetings with just four out of 100 total contacts (4%). Through week three, we had four meetings out of 51 total contacts (8%). That is double the meeting rate!
- Proposal, Customer, Monthly recurring revenue (MRR): Through week three, these have all come in at zero. So far, the improvements higher up in the funnel due to the experiment haven't kicked off new customers for Nectafy. But with a sales cycle always longer than a few weeks, we hope to see these results come in later in the experiment. If they didn't, we may learn that the extra effort in the sales process wasn't worth it. We shall see.
As we get closer to 100 leads in the experiment (we're just 51% of the way there now), we hope to see some of the top-of-funnel improvements kick down to the bottom. There is hope since our sales cycle is usually longer than 30 days.
We'll update you next week.
Week 4 Results: Through 70 Leads
The Data
Week 4 Takeaways
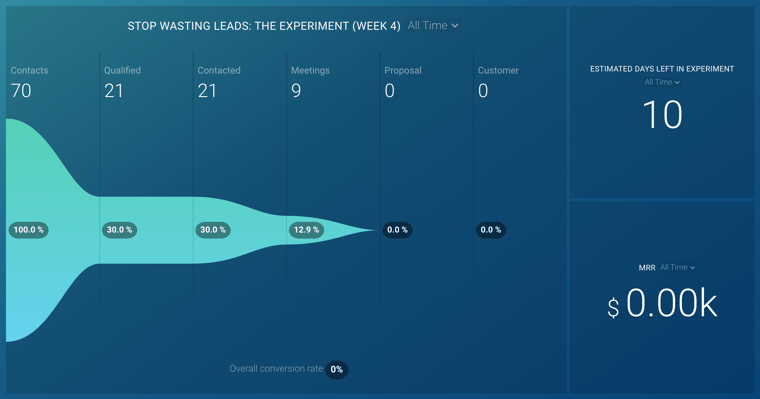
After week three, the meeting rate was double that of the benchmark. With 5 meetings taking place within week four alone, the meeting rate is now more than triple that of the benchmark. With personalized video emails for each qualified lead, it's clear that more people are willing to meet. Now, we still need to see if that turns into more proposals and customers.
- Qualified: The percentage of qualified contacts as a percentage of total contacts has gone up (30% through week four vs. 15% in the benchmark). However, we're not doing anything in this experiment specifically to impact that number.
- Contacted: In the benchmark, we contacted just five out of 100 total contacts (5%). Through week four, we contacted 21 out of 70 leads (30%). We've benefited from more qualified leads, but the experiment has made sure we get in touch with each. That simple process increase our opportunity quite a bit.
- Meetings: In the benchmark, we had meetings with just four out of 100 total contacts (4%). Through week four, we had nine meetings out of 70 total contacts (13%). That is more than triple the meeting rate!
- Proposal, Customer, Monthly recurring revenue (MRR): Through week four, these have all come in at zero. So far, the improvements higher up in the funnel due to the experiment haven't kicked off new customers for Nectafy. Our experiment ends next week, but we'll keep tracking this group of leads through to the end. We're hoping the sales cycle is longer than the experiment.
Week 5 Results: Through 100 Leads
The Data
Week 5 (Final) Takeaways
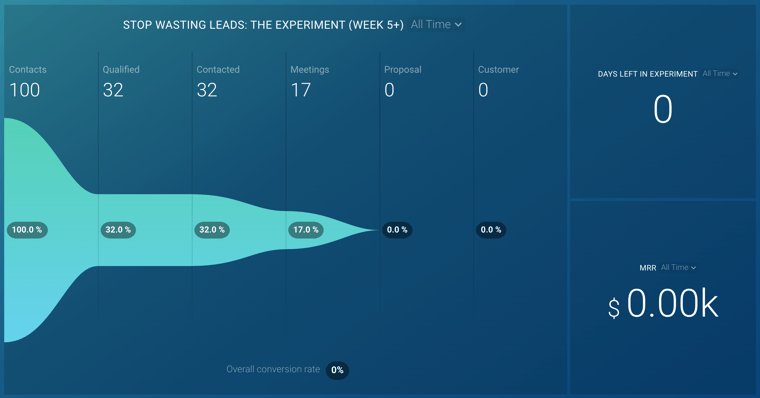
We are through the entire experiment! 100 leads have come in and we've contacted each qualified lead with a personalized video. The contact rate and meeting rate from the experiment crushed those numbers from the benchmark. Unfortunately, that didn't bring in more proposals, customers, or sales.
The question persists: was the effort and improvements at the top of the sales process all for naught, or do we need to give it more time to see if some new customers close?
- Qualified: The percentage of qualified contacts as a percentage of total contacts was much higher during the experiment (32% vs. 15% in the benchmark). However, we didn't do anything in this experiment specifically to impact that number.
- Contacted: In the benchmark, we contacted just five out of 100 total contacts (5%). In the experiment, we contacted 32 out of 100 leads (32%). We've benefited from more qualified leads, but the experiment has made sure we get in touch with each. That simple process increase our opportunity quite a bit.
- Meetings: In the benchmark, we had meetings with just four out of 100 total contacts (4%). In the experiment, we had 17 meetings out of 100 total contacts (17%). That is more than quadruple the meeting rate!
- Proposal, Customer, Monthly recurring revenue (MRR): Through the experiment, these have all come in at zero. The improvements that came higher up in the funnel haven't kicked off new customers for Nectafy. We'll keep tracking this group of leads through to the end, though. We're hoping the sales cycle is longer than the experiment.
Want to see if any of the 100 leads turn into customers? Subscribe below.
We will continue to update the results by tracking these 100 leads throughout their sales cycles with Nectafy.
