How To Statistically Prove What Blog Posts Bring In The Best Leads


When I was younger, it seemed like the more friends or toys someone had, the better. But as I grew older, I truly came to appreciate the phrase “quality over quantity.” I’ll pick a few of my closest friends and a really good meal every single time over a roomful of acquaintances and a buffet lined with sub-par snacks.
It turns out that the same logic can be applied to your company’s blog. While it’s awesome that your blog is attracting hundreds, if not thousands, of leads every month, it’s safe to say that a majority of these leads aren’t converting into customers. So how can you make sure you’re not solely focused on the quantity of leads coming to your blog, but also the quality?
Well, just a few months ago, Henry did what he does best and pulled some seriously impressive data for a client—this time on blog analytics. He wanted to see what blog posts were attracting leads, and more importantly, the quality of leads they were bringing in. So with the assistance of our client, who really helped Henry hone in on the data, a new reporting strategy was born. And in true Nectafy fashion, we’re sharing this same exact approach with you.
Statistically Prove What Blog Posts Bring In The Best Leads
I’m happy to report that figuring out what blog posts are bringing in the best leads is actually quite simple. You don’t even have to dive into any complicated blog analytics—all you need is a HubSpot list and these two contact properties:
- Lead tier* (keep on reading for more info on this custom property)
- First page seen
*Note: Creating this custom property isn’t mandatory and the strategy outlined in this article can also be done by replacing the lead tier property with the marketing qualified leads (MQLs) property. But for purposes of this example, I’ll show you how to create lead tiers, below.
Hold up… What exactly is a lead tier?
I’m glad you asked. A lead tier is a way to categorize your leads. Whether you choose to call them Tier A, B, and C or Tier 1, 2, and 3 leads is completely up to you—the purpose is to identify what a quality lead means for your company.
Here’s an example for one of our clients:
- A Tier A lead is anyone with an IP Country equal to the United States or Canada.
- A Tier B lead is anyone with an IP Country equal to the United Kingdom, Mexico, Brazil, Argentina, Colombia, Peru, Chile, or Ecuador.
- A Tier C lead is anyone with an IP Country other than one of those listed above.
Again, keep in mind that what determines a highly qualified lead is completely up to you. For this particular client, it’s contingent upon the contact’s IP location, but factors like organization size, job title, or email address provider may be a more important indicator of a strong lead for your company.
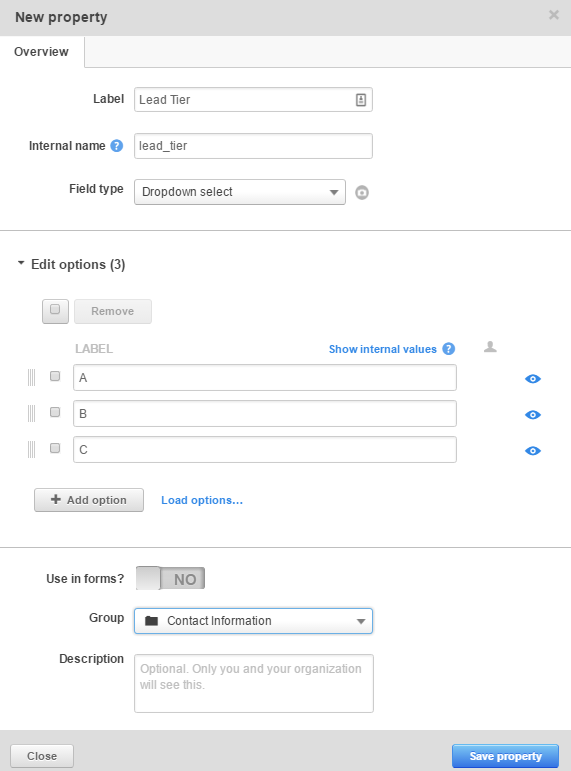
Once you’ve identified your lead tiers you’ll want to create a new contact property in HubSpot called “Lead Tier.” (More on how to do that, here.) It will look something like this:

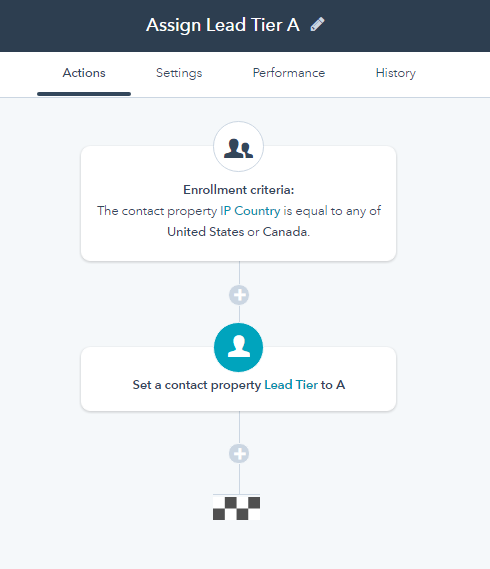
Next, you’ll set up workflows to assign contacts to a lead tier based on your tier qualifier. In keeping with the IP Country example, the workflow to assign a contact to Tier A would look like this:

Crunching The Data
Now that you have your lead tier contact property and assignment workflows up and running, you’ll be able to take a look at your blog analytics and match articles to tier leads. Here’s how:
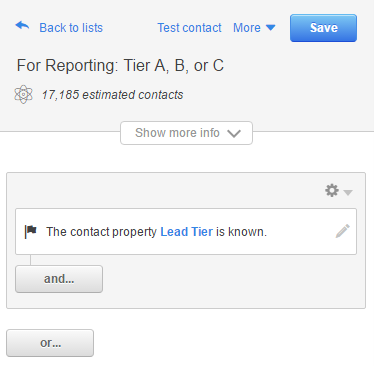
1. Set up a list in HubSpot that says the contact property Lead Tier is known.

2. Export the list and include the following properties:
- Lead tier
- First page seen
3. Rename this tab “Data” and sort the spreadsheet by first page seen (for the purposes of this article, delete all pages that aren’t blog post URLs, or just export all of your blog pages).
Additional tip: You’ll probably export a number of URLs that have tracking codes attached to them. They look like this:

You would want to count that URL the same as just example.com/article/. To do that, create a new column to the right of your “first page seen” column, and use a “LEFT” and “FIND” function to remove the source code. It will look like this:
=LEFT(C3,FIND("?",C3)-1)
That will strip out the source code (ie. everything after the question mark) and return you the actual URL. This column will give you a better list of your actual blog post URLs.
4. The first tab contains the contact attributes from the raw HubSpot export. You’ll need to create a second tab, called “Analysis,” which will look at the information in the Data tab and make the necessary formulas to synthesize the raw data.
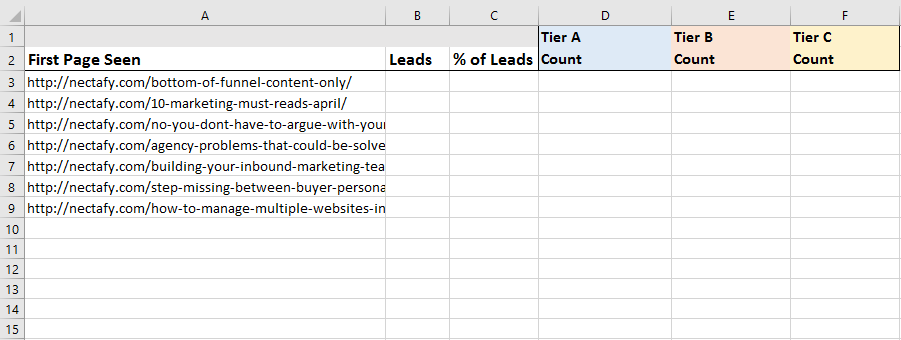
5. Copy over the First Page Seen column to the Analysis tab, remove any duplicate URLs, and add in columns for Leads, % of Leads, and Tier A, B, and C Count.

Notes:
- When pasting into the "Analysis" tab, "Paste special" and then "Paste values only."
- For step-by-step instructions on removing duplicates:
- Click here for Excel
- Click here for Google Sheets
6. Next comes the fun part (according to Henry; personally, I beg to differ). To determine the number of leads that came from each blog post, you’ll use the COUNTIF function, which is a way in Excel (or Google Sheets) to count the number of cells that meet a certain criterion. Here’s how the formula works:
- In the leads column of the Analysis tab (for example, cell B3), enter: =COUNTIF(
- Switch to the Data tab and click on the top of the First Page Seen column to highlight the entire column (for example, column D).
- The formula should now read =COUNTIF(Data!D:D
- Add a comma, navigate back to the Analysis tab, click on the blog post you are calculating leads for (for example, A3), and close the parentheses.
- The formula should now read =COUNTIF(Data!D:D, A3)
- Hit enter for the calculation to appear.
If a lead's first page seen is this particular blog URL, the COUNTIF function will count them here. This will quickly count up all of your leads from each specific post.
7. Copy this formula for every blog post so your entire Leads column is complete. At the bottom, sum the column to get the total number of leads.
8. In the % of Leads column, divide the number in the Leads column by the total number of leads to see the percentage of leads that originated from each blog post.
9. The final step is to utilize the COUNTIFS function, which counts if two things are happening. In this case, we want to calculate the data to look at the contact’s first page seen AND the contact’s lead tier.
Here’s how the formula works using Tier A as an example:
- In the leads column (for example, cell B3), enter: =COUNTIFS(
- Switch to the Data tab and click on the top of the First Page Seen column to highlight the entire column (for example, column D).
- The formula should now read =COUNTIFS(Data!D:D
- Add a comma, navigate back to the Analysis tab, click on the blog post you are are calculating leads for (for example, A3), and add another comma.
- The formula should now read =COUNTIFS(Data!D:D, A3,
- On the Data tab, find the Lead Tier column. Click on the top of it to highlight the entire column (for example, column E).
- The formula should now read =COUNTIFS(Data!D:D, A3, DATA!E:E,
- Add a comma, and then manually type in the lead tier you want to look at. For Tier A leads, you would type “A” and close the parentheses.
- The formula should now read =COUNTIFS(Data!D:D, A3, DATA!E:E, “A”)
- Hit enter for the calculation to appear.
10. Copy this formula for every blog post in the Tier A Count column, and repeat for the Tier B and Tier C Count columns as well.
I promise you, the above steps aren’t as complicated as they sound. Once you have a handle on the COUNTIF/COUNTIFS functionality, this strategy really is a breeze! (You could also just download this nifty template instead, which will do the calculating for you!)
Now what should I do with this data?
Once your blog analytics are complete, the spreadsheet will paint a clear picture of the percentage of leads by blog post, and then, more importantly, the breakdown of leads by Tier.
After reviewing the data you’ll likely notice some trends. For example, one of your blog posts intended for top-of-funnel contacts may be bringing in highly qualified (Tier A) leads. If this is the case, you’ll want to write more about that particular topic, since it’s clearly attracting the type of leads you want.
Conversely, if a blog article intended for bottom-of-funnel leads attracts Tier C leads who aren’t taking any steps toward becoming an MQL, you’ll likely want to stop writing about it, since this topic isn’t bringing in the people you want.
While pushing large numbers of contacts to your site via your blog is a great strategy, it really doesn’t mean a whole lot if you aren’t attracting the right people. But this analysis allows you to hone in on which blog topics are bringing in (or have the most potential to bring in) those Tier A leads.
I’d love to hear what strategies and tools you’ve used to determine the quality of your blog leads! Leave a comment or tweet us @nectafy.

